The FY24 union budget, presented on 1st February 2023, pegged india’s fiscal deficit at 5.9% of GDP in FY24, after 6.4% in FY23, in line with the envisaged glide path to get to below 4.5% by FY26. However, the level of fiscal deficit is estimated to rise from Rs. 17.55 lakh crore in FY23 to Rs. 17.87 lakh crore in FY24 and net market borrowing, to fund this, is to rise from Rs. 11.1 lakh core to Rs. 11.8 lakh crore. Gross borrowing is therefore set to increase from Rs. 14.2 lakh crore in FY23 to Rs. 15.4 lakh crore in FY24.
On actual borrowing during FY23, G-sec didn’t have any major suprises, t-bill was revised higher by Rs. 50,000cr after the union budget (done through higher amounts in March auctions) and states’ SDLs (State Development Loans) undershot calendar amount as it did in FY22. India’s FY24 borrowing calendars for central government dated securities (H1) and t-bills (Q1) were released in this context. Below are the key takeaways, quarterly and half-yearly comparisons.
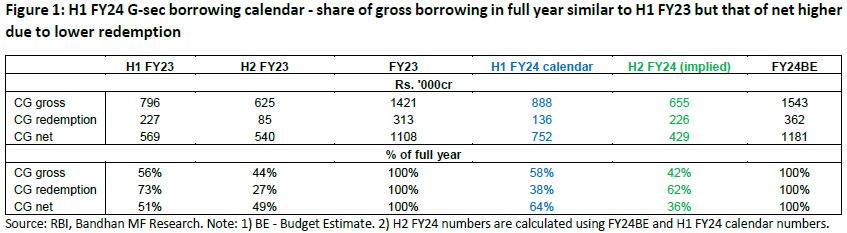
For G-sec borrowing, we note:
1) Gross borrowing in FY24 - H1 is Rs. 8.88 lakh crore, FY24BE is Rs. 15.43 lakh crore & implied H2 is Rs. 6.55 lakh crore.
2) Net borrowing in FY24 - H1 is Rs. 7.52 lakh crore, FY24BE is Rs. 11.81 lakh crore & implied H2 is Rs. 4.29 lakh crore.
3) Share of H1 and H2 gross borrowing in full year - 58% in H1 and 42% in H2 vs. 56% in H1 and 44% in H2 of FY23.
4) Share of H1 and H2 net borrowing in full year - 64% in H1 and 36% in H2 vs. 51% in H1 and 49% in H2 of FY23. Share of net borrowing in H1 FY24 is higher (vs. H1 FY23) because share of redemption is lower.
5) Note - In the FY24 union budget, total G-sec redemption for FY24 was reduced by Rs. 78,104cr for ‘net recovery from GST compensation fund’. Redemption numbers above (Figure 1) for H1 and H2 of FY24 have been adjusted accordingly (Rs. 23,000cr for H1 and Rs. 55,104cr for H2).
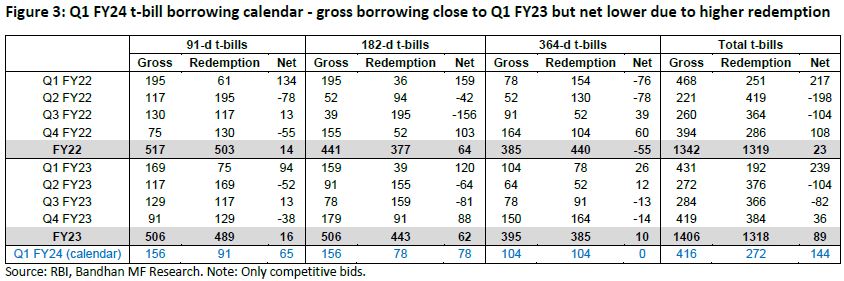
For t-bill borrowing (only competitive bids), we note:
1) Gross borrowing was Rs. 14.1 lakh crore in FY23 (vs. RS. 13.4 lakh crore in FY22) and net Rs. 89,000cr in FY23 (vs. Rs. 23,000cr in FY22). The major contributor to higher net borrowing in FY23 was 364d t-bills (+Rs. 10,000cr in FY23 vs. -Rs. 55,000cr in FY22). The % shares of 91-d, 182-d and 364-d t-bills in full year gross borrowing was not very different from that in FY22.
2) Gross Q1 FY24 t-bill borrowing as per calendar is Rs. 4.16 lakh crore vs. Rs. 4.31 lakh crore in Q1 FY23 and Rs. 4.68 lakh crore in Q1 FY22.
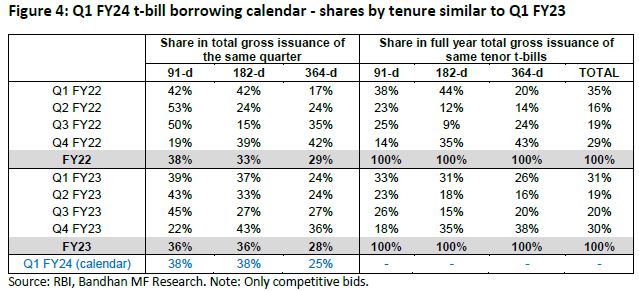
3) Within quarterly gross t-bill borrowing, % shares of 91-d, 182-d and 364-d t-bill borrowings are similar to Q1 FY23.
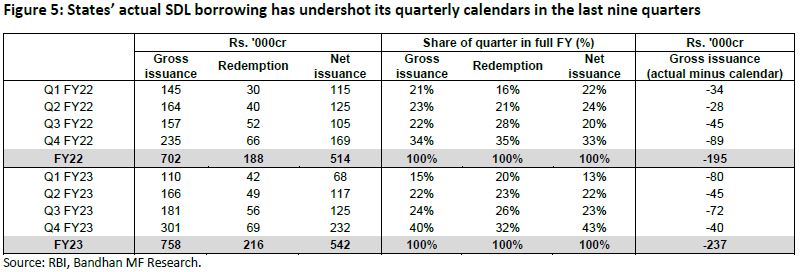
For states’ SDL borrowing, Q1 FY24 calendar for which is not yet out at the time of writing, we note:
1) Total FY23 gross borrowing was Rs. 7.58 lakh crore, with Q4 ending at Rs. 3 lakh crore (vs. calendar for Rs. 3.4 lakh crore) and thus an undershoot of Rs. 40,000cr. Every quarter since Q4 FY21 has witnessed an undershoot in borrowing vs. calendar. Total FY23 undershoot was Rs. 2.37 lakh crore (after Rs. 1.95 lakh crore in FY22) as states have been spending less, particularly on capex, compared to both budgeted numbers and actual revenue growth.
2) However, the undershoot in Q4 FY23 (Rs. 40,000cr) was lesser than that in Q3 (Rs. 72,000cr). Borrowing in recent SDL auctions have been higher than calendar. For e.g., states borrowed Rs. 38,000cr and Rs. 31,000cr lower than the respective calendar amounts in January and February but they borrowed Rs. 29,000cr more in March.
Disclaimer:
MUTUAL FUND INVESTMENTS ARE SUBJECT TO MARKET RISKS, READ ALL SCHEME RELATED DOCUMENTS CAREFULLY.
The Disclosures of opinions/in house views/strategy incorporated herein is provided solely to enhance the transparency about the investment strategy / theme of the Scheme and should not be treated as endorsement of the views / opinions or as an investment advice. This document should not be construed as a research report or a recommendation to buy or sell any security. This document has been prepared on the basis of information, which is already available in publicly accessible media or developed through analysis of Bandhan Mutual Fund. The information/ views / opinions provided is for informative purpose only and may have ceased to be current by the time it may reach the recipient, which should be taken into account before interpreting this document. The recipient should note and understand that the information provided above may not contain all the material aspects relevant for making an investment decision and the security may or may not continue to form part of the scheme’s portfolio in future. Investors are advised to consult their own investment advisor before making any investment decision in light of their risk appetite, investment goals and horizon. The decision of the Investment Manager may not always be profitable; as such decisions are based on the prevailing market conditions and the understanding of the Investment Manager. Actual market movements may vary from the anticipated trends. This information is subject to change without any prior notice. The Company reserves the right to make modifications and alterations to this statement as may be required from time to time. Neither Bandhan Mutual Fund (formerly known as IDFC Mutual Fund)/ IDFC AMC Trustee Company Limited (proposed to be changed to Bandhan Mutual Fund Trustee Limited, awaiting registration) / IDFC Asset Management Co. Ltd (proposed to be changed to Bandhan AMC Limited, awaiting registration), its Directors or representatives shall be liable for any damages whether direct or indirect, incidental, punitive special or consequential including lost revenue or lost profits that may arise from or in connection with the use of the information.